TL;DR
- Performance API is a great (native) way to measure how long certain Front-End interactions take.
- Its Observable API allows for easy plug-in of existing monitoring tools.
- It’s only a few lines of code and you’re good to ship.
To measure the performance of your app’s functionality, you will need to add Markers and Measures into your code.
Ideally, you add those into critical parts of your application where you want to ensure that they stay performant over time.
What is a Mark and Measure?
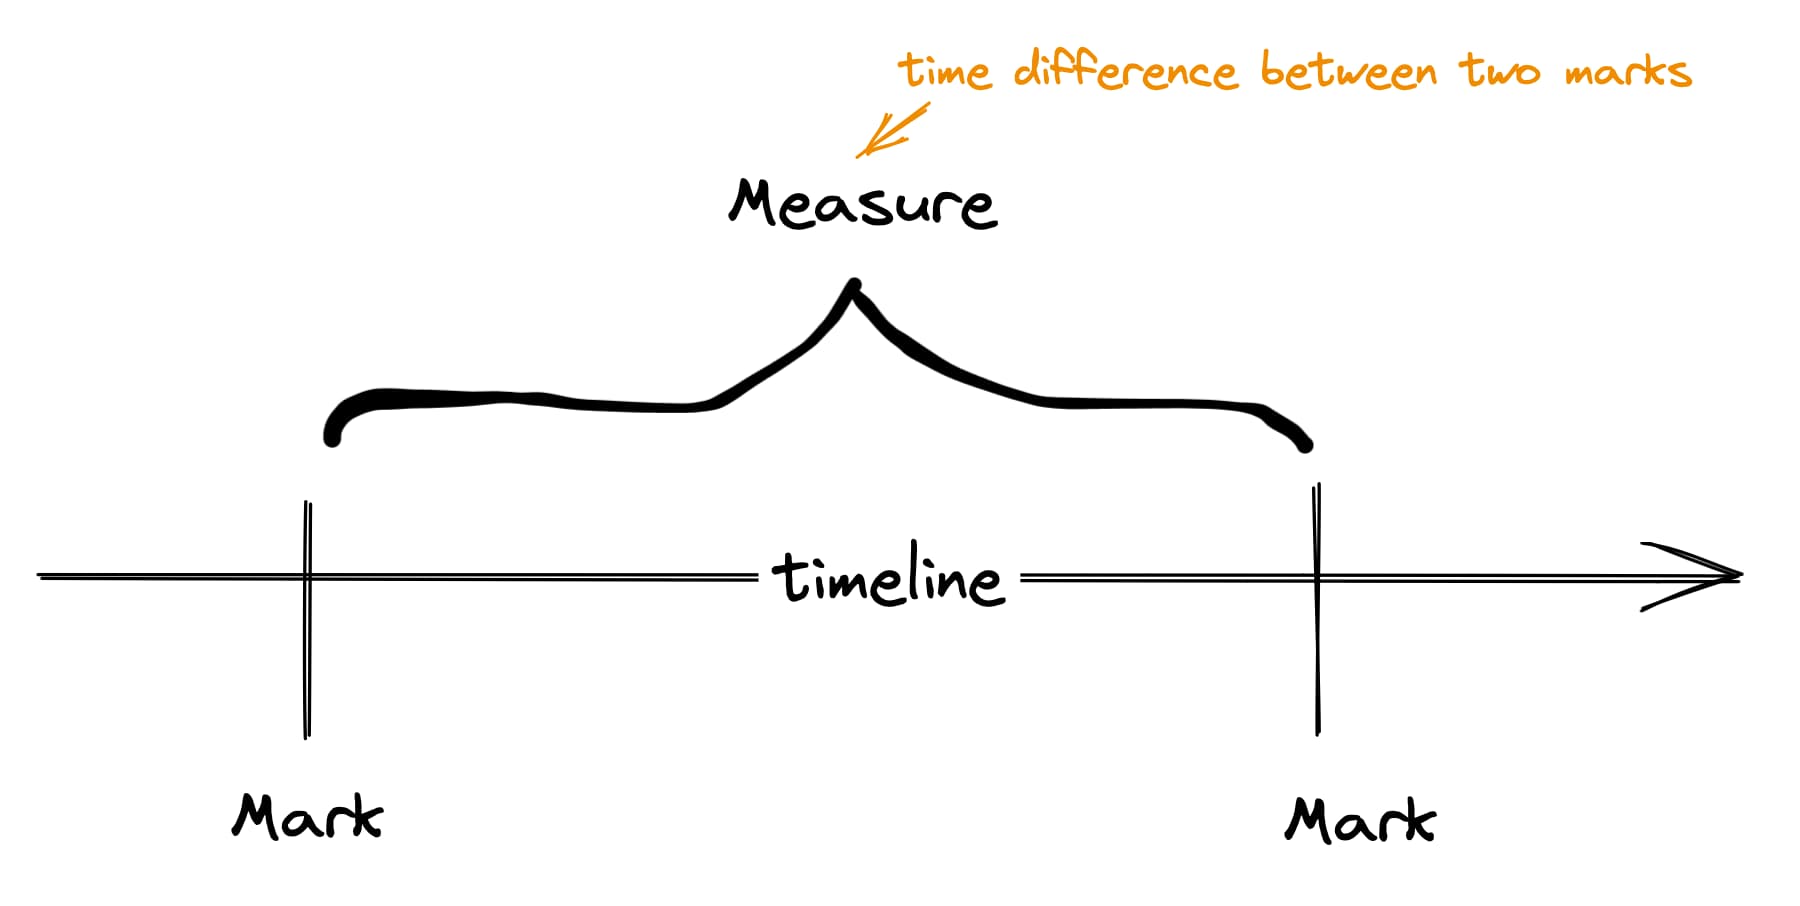
Working with Performance API, you will see Mark and Measure mentioned a lot. Understanding the difference between those two is essential.
- Mark is an object that represents an event on a timeline. It’s created using
performance.mark()call. - The measure is a measurement between two of those marks. It’s created using
performance.measure()call.
Basic use case
Let's measure how long it takes to show the next image after clicking the button.
For that, we will have to add two markers - one for button clicked and one for image loaded. With marks in place, we can then measure the time between them.
(Full example in Codesandbox).
button.addEventListener('click', () => {
  performance.mark("button-clicked") // <-- mark button click

  let response = await fetch('...').then(r => r.json())
  let imgEl = document.querySelector('#img')

  imgEl.addEventListener("load", () => {
    performance.mark("image-loaded") // <-- mark image loaded

    let measure = performance.measure(
      "load-next-image-duration", // measure name
      "button-clicked", // start mark
      "image-loaded" // end mark
    )

    console.log(`${measure.name}'s duration: ${measure.duration}`)
  }, {once: true})

  imgEl.src = response.url
});
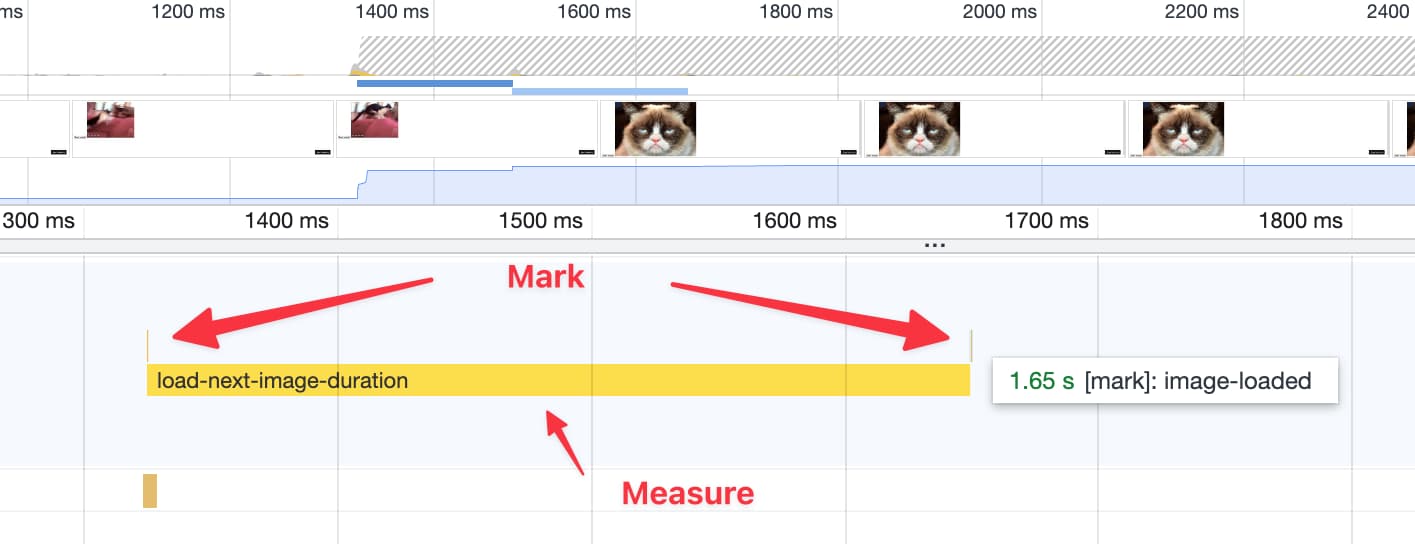
The benefit of using the native API is that it also shows up your markers and measures in DevTools.
Sending measures to external monitoring tools
One last step is to actually log those performance measures into external systems, where you can then analyze your performance trends over time.
The Measure object has name and duration properties that are ideal candidates to be sent.
With PerformanceObserver API, it’s just a few lines of code.
function perfObserver(list, observer) {
  list.getEntries().forEach(entry => {
    // replace with monitoring tool of your choice
    newrelic.addPageAction(entry.name, { duration: entry.duration })
  })
}

const observer = new PerformanceObserver(perfObserver)
observer.observe({ entryTypes: ["measure"] })
And that’s it. I hope this short introduction helped you to understand how easy it is to use Performance API to monitor your app.
For advanced use cases, visit the MDN docs for Performance API.